File:Frontal horn, intercaudate and inner table ratios (diagram) (Radiopaedia 10768).jpg
Jump to navigation
Jump to search
Size of this preview: 600 × 600 pixels. Other resolutions: 240 × 240 pixels | 480 × 480 pixels | 768 × 768 pixels | 1,024 × 1,024 pixels | 1,600 × 1,600 pixels.
Original file (1,600 × 1,600 pixels, file size: 110 KB, MIME type: image/jpeg)
Summary:
- Radiopaedia case ID: 10768
- Image ID: 26365
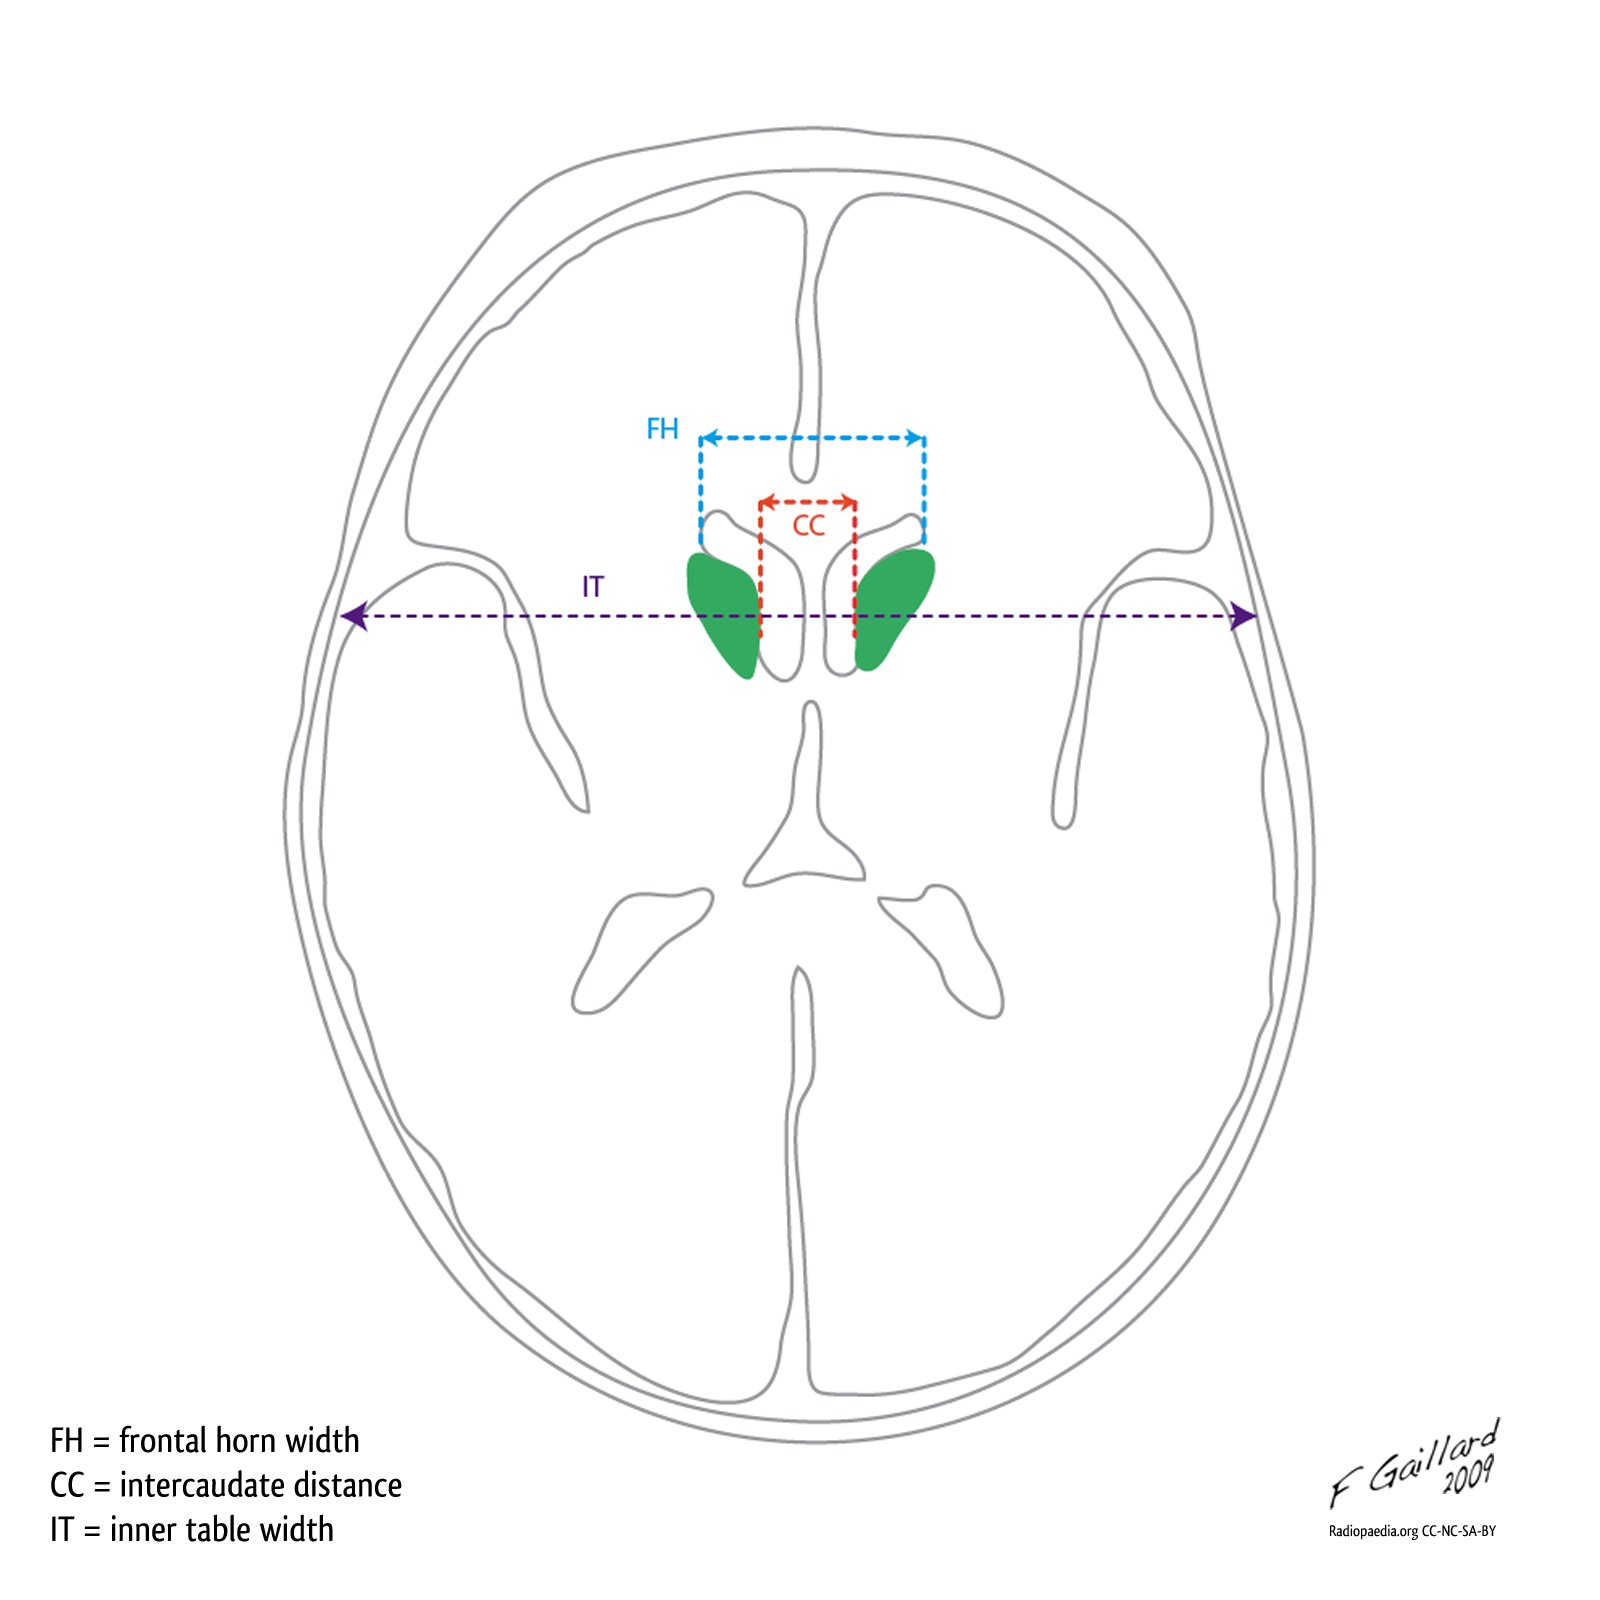
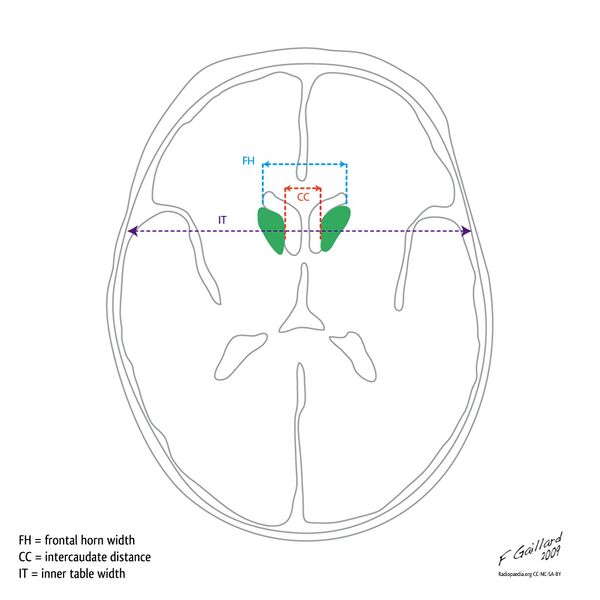
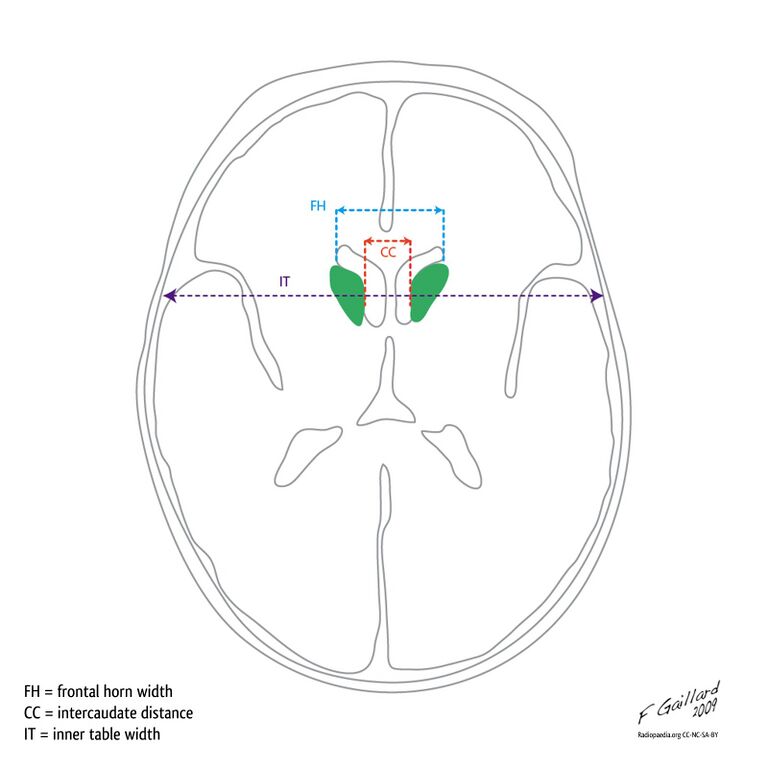
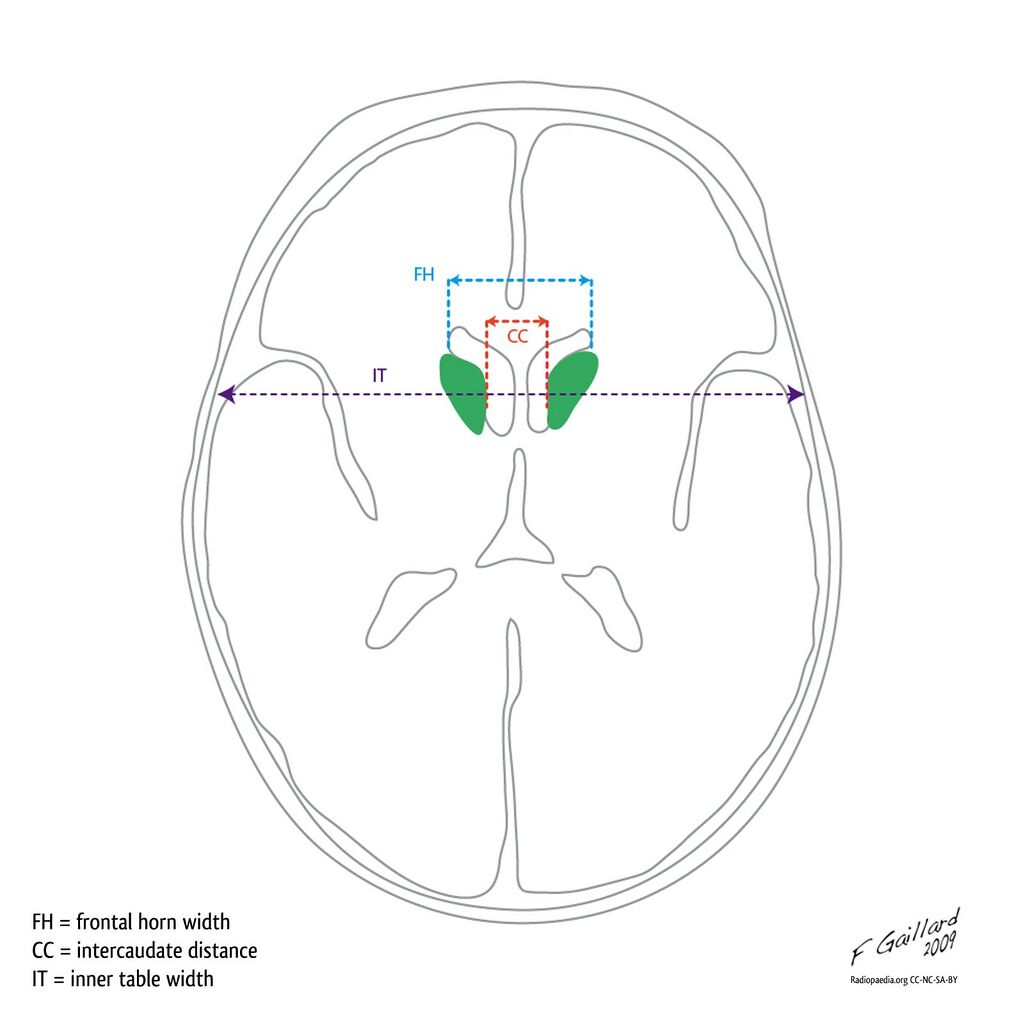
- Study findings: Diagram demonstrating how to measure: FH/CC ratio: normal mean 2.2 to 2.6 (this ratio decreases with aging as a result of enlargement of the frontal horns of the lateral ventricles). CC/IT ratio : normal mean 0.09 to 0.12 Adapted from: Ho VB, HS Chuang, MJ Rovira and B Koo. “Juvenile Huntington disease: CT and MR features.” AJNR Am J Neuroradiol 16, no. 7 (August 1, 1995): 1405-1412.
- Modality: Diagram
- System: Central Nervous System
- Findings: Diagram demonstrating how to measure:
frontal horn width intercaudate distance inner table width FH/CC ratio: normal mean 2. 2 to 2. 6 (this ratio decreases with aging as a result of enlargement of the frontal horns of the lateral ventricles). CC/IT ratio : normal mean 0. 09 to 0. 12Adapted from: Ho VB, HS Chuang, MJ Rovira and B Koo. “Juvenile Huntington disease: CT and MR features. ” AJNR Am J Neuroradiol 16, no. 7 (August 1, 1995): 1405-1412.
- Published: 19th Sep 2010
- Source: https://radiopaedia.org/cases/frontal-horn-intercaudate-and-inner-table-ratios-diagram
- Author: Frank Gaillard
- Permission: http://creativecommons.org/licenses/by-nc-sa/3.0/
Licensing:
Attribution-NonCommercial-ShareAlike 3.0 Unported (CC BY-NC-SA 3.0)
File history
Click on a date/time to view the file as it appeared at that time.
| Date/Time | Thumbnail | Dimensions | User | Comment | |
|---|---|---|---|---|---|
| current | 10:57, 22 March 2021 | | 1,600 × 1,600 (110 KB) | Fæ (talk | contribs) | Radiopaedia project rID:10768 (batch #14178) |
You cannot overwrite this file.
File usage
There are no pages that use this file.
_(Radiopaedia_10768).jpg&oldid=8857994)