File:Ijms-23-12709-g001.jpg
Jump to navigation
Jump to search
No higher resolution available.
Ijms-23-12709-g001.jpg (757 × 233 pixels, file size: 34 KB, MIME type: image/jpeg)
Summary
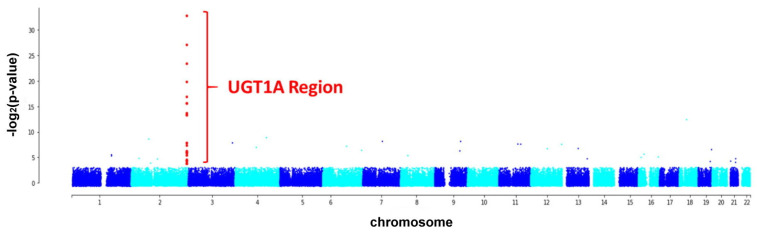
| Description |
English: Manhattan plot visualizing the p-values of the allele frequency changes among the subjects with Gilbert’s syndrome (test group) and healthy individuals (control group). Most of the significant single nucleotide polymorphisms (SNPs) are located in the UGT1A region (chr2:233617645–233773305). |
| Date | |
| Source | https://www.ncbi.nlm.nih.gov/pmc/articles/PMC9603874/ |
| Author | Paul Wei-Che Hsu, Po-Cheng Liao, Yu-Hsiang Kao, Xin-Yu Lin, Rong-Nan Chien,Chau-Ting Yeh, Chi-Chun Lai, Yu-Chiau Shyu, Chih-Lang Lin |
Licensing
{{subst:Custom license marker added by UW}} https://creativecommons.org/licenses/by/4.0/ Attribution 4.0 International (CC BY 4.0)
This file was uploaded with UploadWizard.
File history
Click on a date/time to view the file as it appeared at that time.
| Date/Time | Thumbnail | Dimensions | User | Comment | |
|---|---|---|---|---|---|
| current | 18:47, 13 April 2023 | 757 × 233 (34 KB) | Ozzie10aaaa (talk | contribs) | Uploaded a work by Paul Wei-Che Hsu, Po-Cheng Liao, Yu-Hsiang Kao, Xin-Yu Lin, Rong-Nan Chien,Chau-Ting Yeh, Chi-Chun Lai, Yu-Chiau Shyu, Chih-Lang Lin from https://www.ncbi.nlm.nih.gov/pmc/articles/PMC9603874/ with UploadWizard |
You cannot overwrite this file.
File usage
There are no pages that use this file.