File:PMC5347826 13052 2017 333 Fig2 HTML.png
PMC5347826_13052_2017_333_Fig2_HTML.png (472 × 230 pixels, file size: 73 KB, MIME type: image/png)
License
Attribution 4.0 International (CC BY 4.0)
- &
CC0 1.0 Universal (CC0 1.0) Public Domain Dedication
Summary
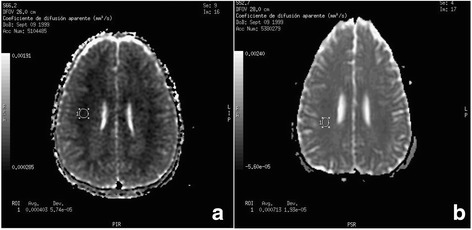
Author:Juan Ignacio Muñoz-Bonet, María del Carmen Ortega-Sánchez, José Luis León Guijarro,Pediatric Intensive Care Unit, Hospital Clínico Universitario, University of Valencia, Department of Pediatrics, Hospital Clínico Universitario(Openi/National Library of Medicine) Source:https://openi.nlm.nih.gov/detailedresult?img=PMC5347826_13052_2017_333_Fig2_HTML&query=HMG%20CoA%20lyase%20deficiency&it=xg&req=4&npos=3 Description:Fig2: Diffusion-Weighted Imaging in MRI, comparing the ADC map, at 72 h (Image a) and after 8 months (Image b). It may be observed that the circular region of interest to determine the ADC value in both images: with values of: 0,4 × 10⁻³ mm2/s at 72 h (restricted diffusion), whilst after eight months the value was 0.7 × 10⁻³ mm2/s (normal ADC map value)
File history
Click on a date/time to view the file as it appeared at that time.
| Date/Time | Thumbnail | Dimensions | User | Comment | |
|---|---|---|---|---|---|
| current | 00:19, 14 January 2022 | | 472 × 230 (73 KB) | Ozzie10aaaa (talk | contribs) | Author:Juan Ignacio Muñoz-Bonet, María del Carmen Ortega-Sánchez, José Luis León Guijarro,Pediatric Intensive Care Unit, Hospital Clínico Universitario, University of Valencia, Department of Pediatrics, Hospital Clínico Universitario(Openi/National Library of Medicine) Source:https://openi.nlm.nih.gov/detailedresult?img=PMC5347826_13052_2017_333_Fig2_HTML&query=HMG%20CoA%20lyase%20deficiency&it=xg&req=4&npos=3 Description:Fig2: Diffusion-Weighted Imaging in MRI, comparing the ADC map, at 72 h... |
You cannot overwrite this file.
File usage
There are no pages that use this file.